

In India, there is no one who don't know about Reliance Industries. From Household sector to Gas sector, they have captured every market. Through this article, we will do Reliance Industries Stock Analysis on the basis of Annual report 2026. We have done the research on reading the Reliance Industries Annual report 2026.
Growth Engines of the Company
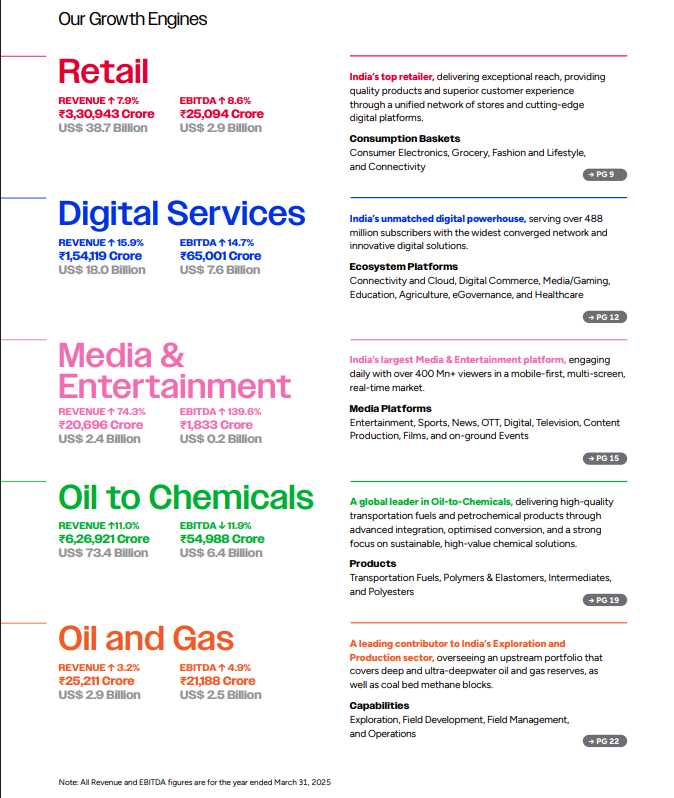
Reliance Industries is no longer just an energy company; it operates as a multi-engine mega-conglomerate. Based on the corporate roadmap data, RIL's modern valuation is driven by six distinct growth engines:
1. Reliance Retail (The Consumer Giant)
- Scale: Crossed a massive ₹3,30,000 crore in annual turnover.
- Footprint: Expanded its hyper-local physical footprint to 19,340 operational stores, solidifying its position as the absolute market leader in India's organized retail sector.
2. Digital Services / Jio (The Data Moat)
- Scale: Emerged as the world's largest data network playing host to 488 million total users.
- Tech Leadership: Successfully migrated a massive chunk of its user base to high-speed networks, capturing 191 million active 5G users.
3. Media (The Entertainment Powerhouse)
- Strategy: Formed a historic corporate mega-merger partnership with Disney, completely reshaping India’s entertainment ecosystem across digital and linear genres.
- Traction: Delivered record-breaking viewership and advertiser engagement metrics within just its first few months of unified operations.
4. Oil to Chemicals / O2C (The Cash Cow)
- Strategy: Maintained heavy baseline operational resilience despite global energy volatility. Done through highly disciplined internal cost management and optimizing domestic product placement.
5. Oil & Gas (Energy Security)
- Performance: Delivered record-breaking segment EBITDA fueled directly by increased deep-water production output from the KG-D6 and CBM (Coal Bed Methane) blocks, advancing India's national energy independence.
6. New Energy (The Future Catalyst)
- Execution: Successfully transitioned from long-term corporate vision into physical execution by operationalizing massive giga-scale solar and battery energy storage factory projects.
Strong and Resilient Performance of Reliance Industries
Even amidst heavy external economic storms, Reliance delivered balanced growth across its diversified operations. The core full-year financial checklist highlights remarkable execution discipline:
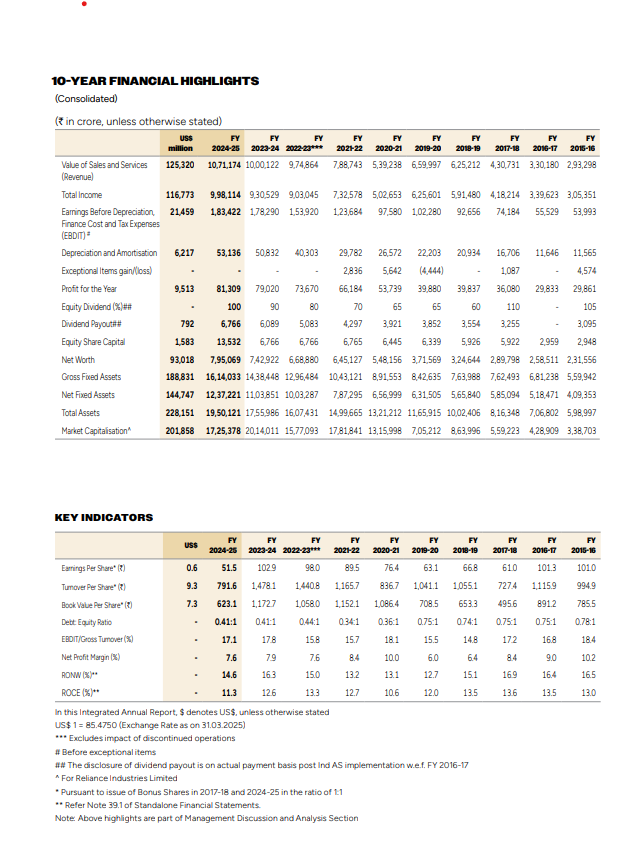
- Consolidated Revenue: Crossed ₹10,71,174 crore, representing a steady +7.1% Year-on-Year (Y-o-Y) growth vector.
- Consolidated EBITDA: Reached ₹1,83,422 crore, scaling up by +2.9% Y-o-Y.
- Consolidated Net Profit: Finished at ₹81,309 crore, matching top-line compounding at +2.9% Y-o-Y.
Core Segment Drivers:
- The Consumer Pivot: Consumer-centric verticals (Retail + Jio) now actively contribute over 50% of RIL's total consolidated EBITDA, permanently de-risking the group from commodity cycles.
- Jio Absorption: A major mid-year tariff revision was cleanly absorbed by the market with zero negative impact on user data consumption trends.
- Retail Efficiency: Retail EBITDA grew by 8.6%, driven by network optimization and major productivity gains across warehouses.
10-Year Financial Highlights and Key Indicators
1. The Revenue and Asset Explosion
- Top-Line Scaling: Over the last decade, RIL's consolidated revenue has scaled from ₹2.93 Lakh Crore to an absolute peak of ₹10.71 Lakh Crore.
- Asset Accumulation: Total Assets on the balance sheet have surged exponentially, moving from ₹5.98 Lakh Crore a decade ago to ₹19.5 Lakh Crore. This highlights a corporate engine that constantly reinvests its cash back into heavy, hard infrastructure.
2. The Capital Reserves Moat
- Total Equity: Total equity grew to a historic domestic corporate milestone of ₹8.16 Lakh Crore, proving that the underlying book value backing each equity share is steadily compounding year after year.
- Cash Flow Baseline: Consolidated Cash Profit finished strong at ₹1,46,917 crore (up from ₹1,41,969 crore in the prior fiscal year), confirming that the company's real cash-generation capabilities remain liquid, heavy, and defensive.
Financial Performance (Global Environment vs. Reliance)
To judge a business fairly, you have to compare its results against the economic backdrop it operated in.
The Global Macro Picture (Headwinds)
The global economy grew at a stable 3.3% while global inflation moderated down to 5.7%. While this allowed central banks to cut interest rates by 50–100 bps, geopolitical conflicts and trade tariff threats created severe volatility in global energy markets.
- The Impact: Transportation fuel margins flattened out from historical highs, and downstream chemical margins crashed under intense pressure due to a massive wave of cheap, incremental product supply entering the market from China.
The Indian Macro Picture (Tailwinds)
Despite global economic cracks, India held its ground as the fastest-growing major economy in the world with a resilient 6.5% GDP growth rate. Though a macro credit tightening slowed down personal loans and an extended election/monsoon season softened demand early on, a major festive season rebound strongly revived domestic consumption in the second half of the year.
The Verdict: How Reliance Outperformed
While global energy supply shocks forced Reliance’s cyclical Oil-to-Chemicals (O2C) segment EBITDA down by 11.9%, RIL’s domestic-facing consumer segments completely absorbed the blow:
- Digital Services EBITDA surged by +14.7% on the back of rapid 5G and fiber-to-the-home broadband adoption.
- Retail EBITDA climbed by +8.6%, turning localized Indian consumption growth into reliable corporate cash flow.
Key Analysis of the Consolidated Balance Sheet
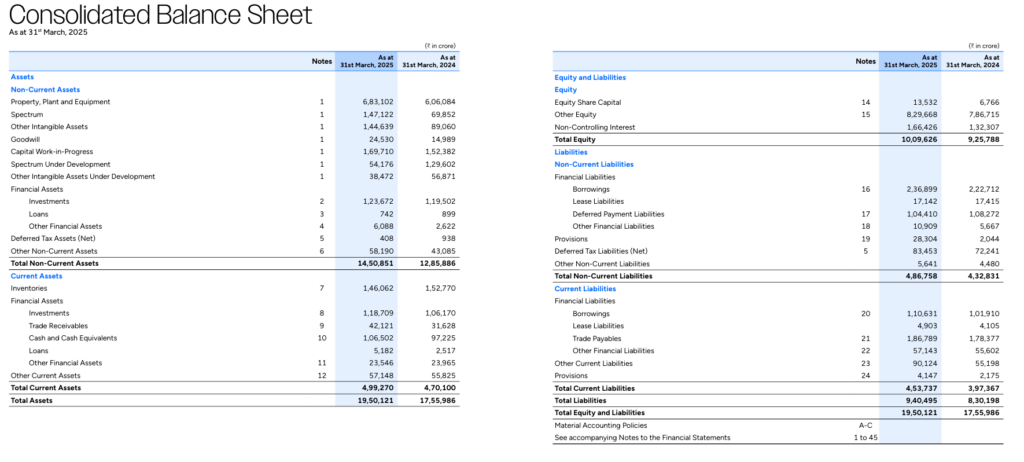
Opening up the raw Consolidated Balance Sheet reveals how Reliance handles its enormous capital stack:
Total Equity & Liabilities= ₹19,50,121 Crore
Total Non-Current Assets (Hard Infrastructure) = ₹14,50,851 Crore
1. Strategic Debt Infrastructure
Long-Term Borrowings stand at ₹2,36,899 Crore. While that looks like a massive liability to an uneducated investor, comparing it to RIL's ₹19,50,121 Crore asset base reveals a very safe and healthy Debt-to-Equity ratio. The company uses this debt strictly to fund highly productive assets like nationwide telecom towers and retail supply chains.
2. The Capital Work-in-Progress (CWIP) Metric
A massive ₹1,69,170 Crore is currently locked in Capital Work-in-Progress.
- This represents cash that has already been spent on massive infrastructure (like New Energy Gigafactories and deep-water gas wells) but hasn't been officially turned on yet. This cash is currently generating zero profit. Once these projects go live, this CWIP line item will move into "Fixed Assets," unleashing a brand-new wave of revenue and profit.
Financial Ratios Analysis
The core valuation and efficiency ratios explain exactly how the stock market prices Reliance Industries:
1. The Valuation Multiples
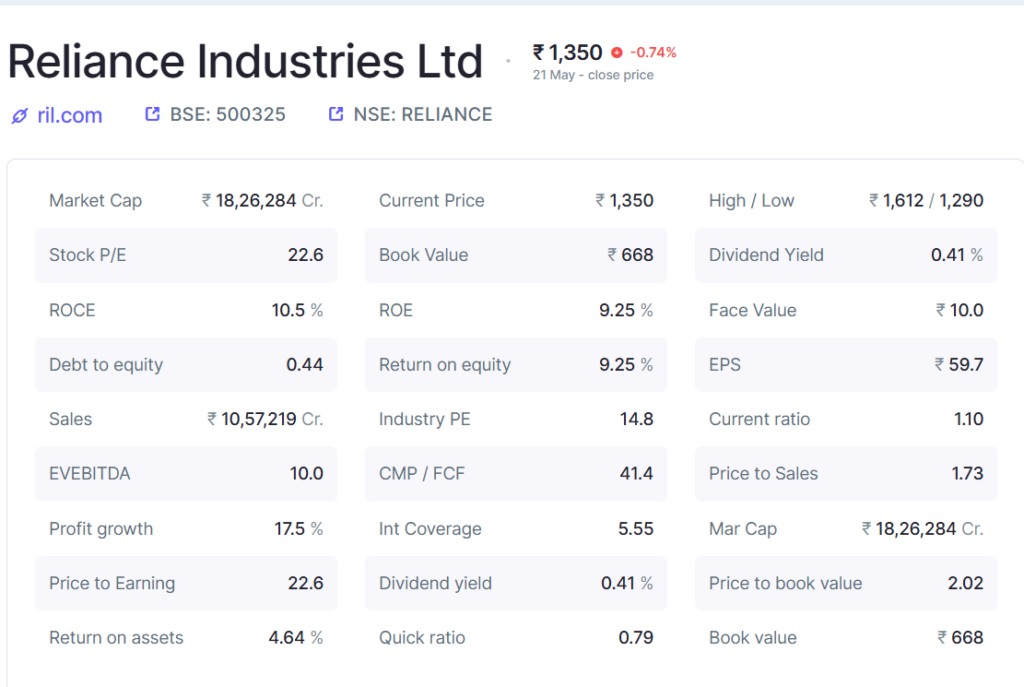
- P/E Ratio (22.6): The market values RIL at 22.6 times its accounting earnings. While standard refining companies trade at a P/E of 14.8, the market rewards Reliance with a premium tech-level multiple because its core growth is driven by digital data and consumer retail.
- P/B Ratio (2.02): Shows that the stock trades at 2.02 times its core book value, reflecting strong institutional confidence in the real value of RIL's underlying assets.
- EV/EBITDA (10): Indicates a very fair, stable valuation for a global conglomerate relative to its total consolidated cash generation capability.
2. Margins and Return Efficiencies
- Operating Margin (13.16%): Proves strong core pricing power across its businesses, heavily defended by Jio’s high software-style margins.
- ROE (9.17%) & ROCE (9.53%): Both efficiency return ratios are sitting just under the 10% mark.
- The Strategic Analysis: This is a classic CapEx Lag Effect. Because Reliance has aggressively poured lakhs of crores into 5G spectrum and retail expansions, its total asset base (the denominator) has inflated instantly. However, these massive infrastructure projects take 2 to 3 years to reach full capacity utilization and generate maximum profits (the numerator). These return ratios look artificially low right now, but they are primed to expand as the heavy spending cycle slows down.
Intrinsic Value of the RIL's Stock
Now, we will reflect to the true value of the stock by the help of Intrinsic Value
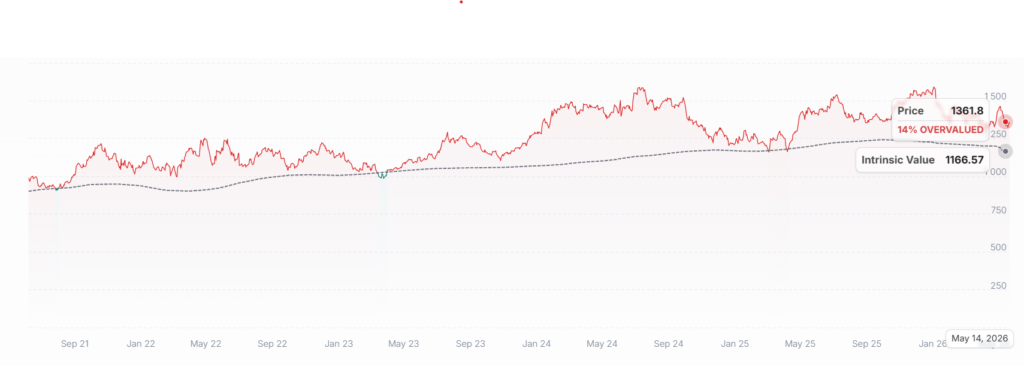
As of 22 May 2026, Alpha Spread analyses the Intrinsic value in three bases
- Bull Case: The intrinsic value for Reliance Industries Ltd (RELIANCE) under the Bull Case is 1982.19 INR. Compared with the current market price of 1354.4 INR, the stock appears Undervalued by 32% .
- Base Case: The intrinsic value for Reliance Industries Ltd (RELIANCE) under the Base Case is 1165.69 INR. Compared with the current market price of 1354.4 INR, the stock appears Overvalued by 14% .
- Bear Case: The intrinsic value for Reliance Industries Ltd (RELIANCE) under the Bear Case is 707.61 INR. Compared with the current market price of 1354.4 INR, the stock appears Overvalued by 48% .
The above calculation of intrinsic value is based upon DCF (Discounted cashflow method) and Multiple-based value. Both method is used to determine the above intrinsic value for Reliance industries stock analysis.
Is Reliance Industries stock good or bad?
After doing well research of Reliance Industries stock analysis, we can conclude that Reliance Industries is a good company because of its vision and numbers. which suggest that Business is running good but a Good Investor not only make decision on the basis on good business but on the basis of True value or Intrinsic value. If it comes below Intrinsic value then you should consider into buying this stock.
Note: We are not SEBI registered stock research company but we educate people how to analyze a stock, Our motto is to give people proper education so that they don't view stock market as a gambling platform. After reading this research, Please do Reliance Industries Stock Analysis from your side.